One un-explained graph? Okay, fine, I watched the effing video, at 1.5x playback speed
And here are some notes that I made as I went along. A bit raw, and please don’t take any of this as a personal attack. But I’m just not buying it.
At 3:30 (and throughout the rest) the line is that because none of the swing states were close enough to trigger an audit, that is the suspicious part. Sorry, but that hits one of my primary anti-consipiracy theory filters. Anything that is by its nature non-falsifiable is highly suspect.
“this could be a potential algorithm changing or deleting votes”
My question is the same as it was to the other side in 2020 - what the flaming foxtrot is this “algorithm” and how does it work?
An algorithm is a defined series of steps that solve a mathematical problem. So you might have an algorithm for sorting a linked list. An algorithm for collision detection in a video game. An algorithm for calculating a network route. And so on.
What you do not have is some dark magical entity that flips facking votes.
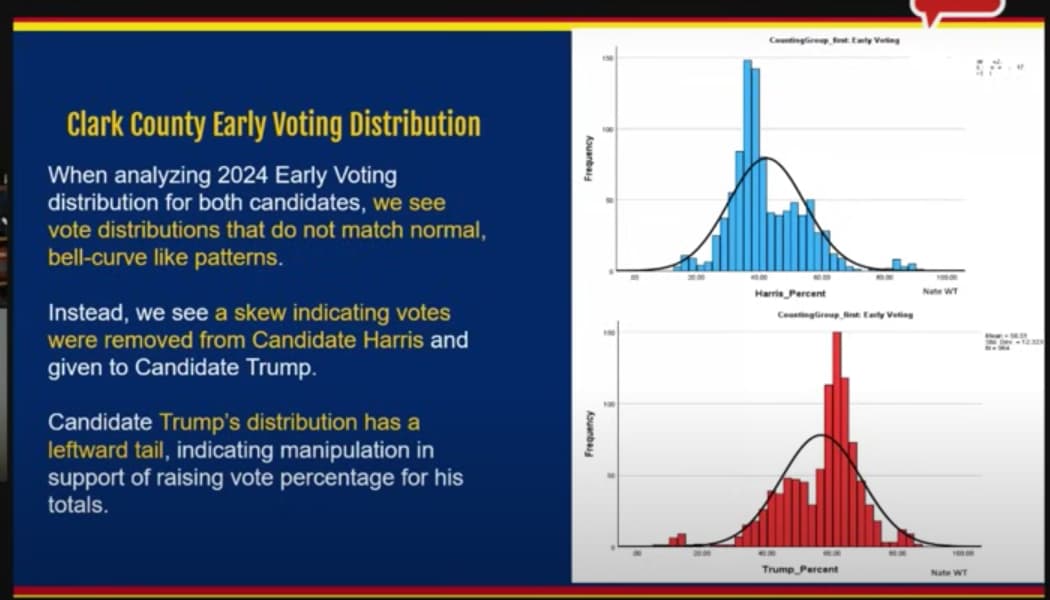
12:40 “Utilizing a binning technique, we can see indication that manipulation occurred.”
Okay, what’s a binning technique?
From WP:
Data binning, also called data discrete binning or data bucketing, is a data pre-processing technique used to reduce the effects of minor observation errors. The original data values which fall into a given small interval, a bin, are replaced by a value representative of that interval, often a central value (mean or median).[citation needed] It is related to quantization: data binning operates on the abscissa axis while quantization operates on the ordinate axis. Binning is a generalization of rounding.
Okay, so “binning” tells me that “stuff wasn’t like we expected”.
Yeah, I actually already knew that. There were several significant demographic shifts in this election, including younger and nonwhite voters going, in some cases outright trumpy, and in others just less dem, that had a significant impact.
But that basically lines up with polling and other indicators. A lot of Biden voters did not come out for Harris. We’ve seen that. And we don’t need any doddam algorithms or binning techniques to see it. It’s not a pleasant thing to see … but it is a thing.
Then at 25:00 or thereabouts, I hear about “synthetic votes being fed in” and it starts sounding like Rudy talking about 2020 Georgia.
So the basic argument, as far as I can distill it, is “2024 doesn’t look like 2020.”
32:45: 70% of tabulation equipment may be compromised (slides were black on my video).
Question: How can you tell the difference between an “anomaly” as presented in this video, and an actual demographic shift in an election?
If we can’t resolve that question, then we can stop before we even get into the “how the heck would this actually work, in the machines, in practice” part. Because it’s just not relevant. I can cherry-pick data any way I want to show sinister patterns. But where did it happen? How did it happen? Why is vote tabulation borked for early voting but not for mail or same day?
THERE WAS A SHIFT IN THE ELECTORATE.
Enough trumpy voters showed up to vote for the disloyal orange sumbitch, and not enough Dem voters showed up to vote for Harris/Walz.
Finis.
Sorry, no disrespect intended, but none of this clears my bullshit filters.